Key business outcomes in many domains entail stateful analytics — carefully analyzing sequence, ordering and timing between events over operational event streams. Writing such stateful analytics queries has been a longstanding open challenge. To address this, Conviva developed a novel “no code” platform that democratizes the creation of complex stateful analytics used in various industries.
We recently demonstrated our platform, SEAM-EZ, in a paper titled “SEAM-EZ: Simplifying Stateful Analytics through Visual Programming” presented at the premier international conference on human-computer interaction, ACM CHI 2024. SEAM-EZ stands for Stateful Event Analytics Made Easy; a tool that makes what used to be a complex problem seem easy.
What Is Stateful Analytics? Why Is it Important?
Stateful analytics over event streams entails carefully modeling the sequence, timing and contextual correlations of events to dynamic attributes. Consider these examples:
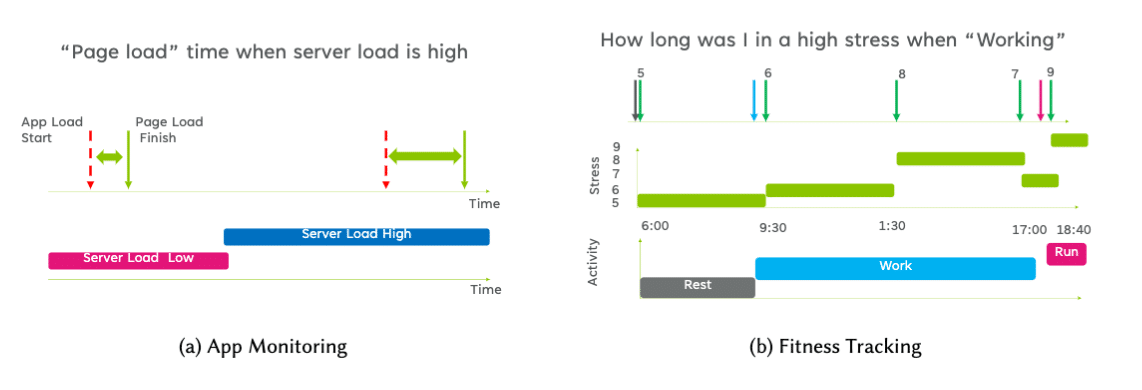
Figure 2. Examples of stateful analytics from different domains that require carefully modeling sequence, timing, and system context when processing event streams.
In this example, fitness tracker data shows a user’s stress and type of activity over time (e.g., start times of rest, work, run). We want to measure the duration in “high stress” when the user is “working,” to help the user avoid prolonged stress exposure (e.g., suggesting breaks between meetings).
App developers may be interested in user experience, such as login time or load time and may want to correlate experience with the backend load (e.g., is the load time high because of server load?).
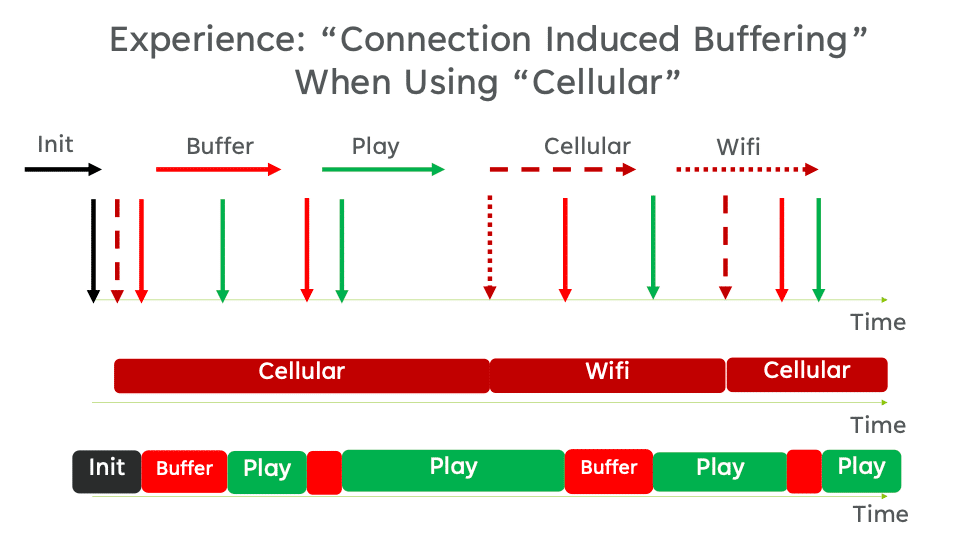
Figure 3: A simplified stateful analytics example from Video Quality of Experience monitoring what our customers care about
This example shows events from a video session, such as initialization, play, buffering and network status. In this case, the provider may be interested in measuring connection-induced buffering time, a key quality of experience metric. This metric requires carefully modeling the sequence of user events, ignoring buffering during initialization or user seeks, and correlating it with the network connection (e.g., cellular).
A fourth example: Internet of Things (IoTs) operators are interested in knowing if devices are in a ”prolonged risky” state; e.g., high battery temperature above 60 Celsius and high memory usage so that they can perform proactive/predictive maintenance.
To understand stateful analytics, it may be useful to contrast it to stateless analytics. Suppose you are interested in the total number of “red” events in the chart showing connection-induced buffering when using cellular data. This measurement will be the same irrespective of the sequence between red and green events, the time difference between the event occurrences, and the current value of the server load.
In stateless analytics, you can logically view data as a “bag of events,” as simple computations like total and average are “stateless.” In contrast, stateful analytics involves carefully modeling time, sequence and order to compute metrics, such as the time between events, how long something lasted or what happened “when” or “before” an event happened.
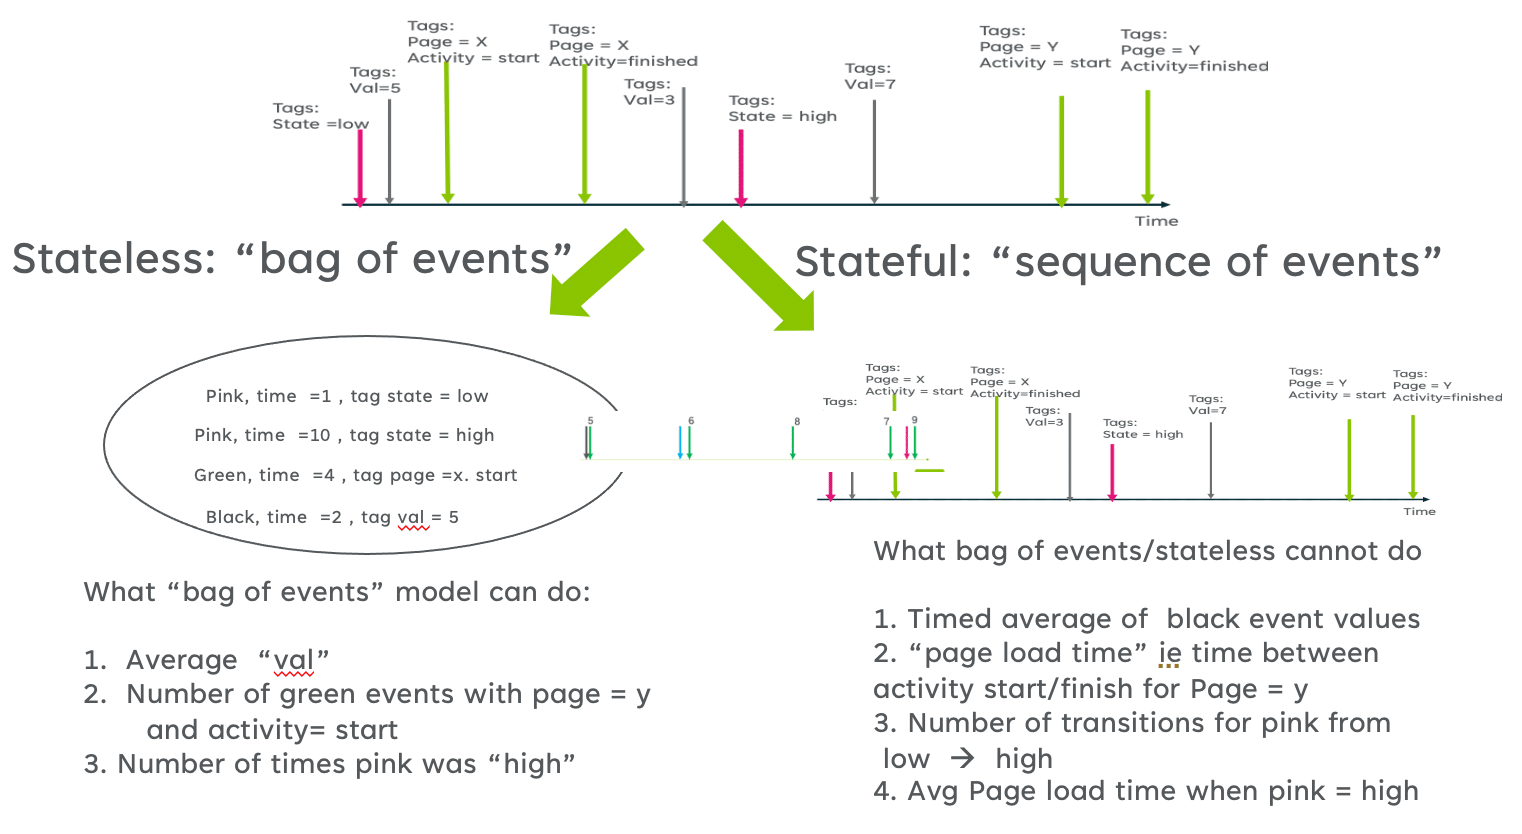
Figure 4: Stateless vs. Stateful Analytics: An Intuitive View
Why Is Stateful Analytics Hard?
However, creating stateful metrics in real-world settings is challenging in part due to the complexity of modeling processes evolving over time. Data scientists and engineers usually have to write and debug complicated SQL queries for stateful metrics such as shown in the figure below. No one expects readers to read this code. That is the primary challenge: stateful analysis without SEAM-EZ entails significant development and debugging complexity.

Figure 5. Before SEAM-EZ, practitioners used to take days and sometimes weeks to develop complex code (e.g., SQL) for stateful analysis. The above code snippet is for the fitness example described above
What Is Visual Programming?
Visual programming (VP), directly using visual elements (e.g., blocks, lines) for constructing computer programs, was proposed by William Robert Sutherland in the 1960s. Since then, there have been a wide range of VP applications for various domains. One widely used visual programming tools is Scratch, which allows children to “write” computer programs by using visual elements such as blocks. We also see emerging usage of VP in the domain of machine learning applications such as the Google Visual Blocks system. In summary, VP has been a powerful idea to lower the barrier of computer programming.
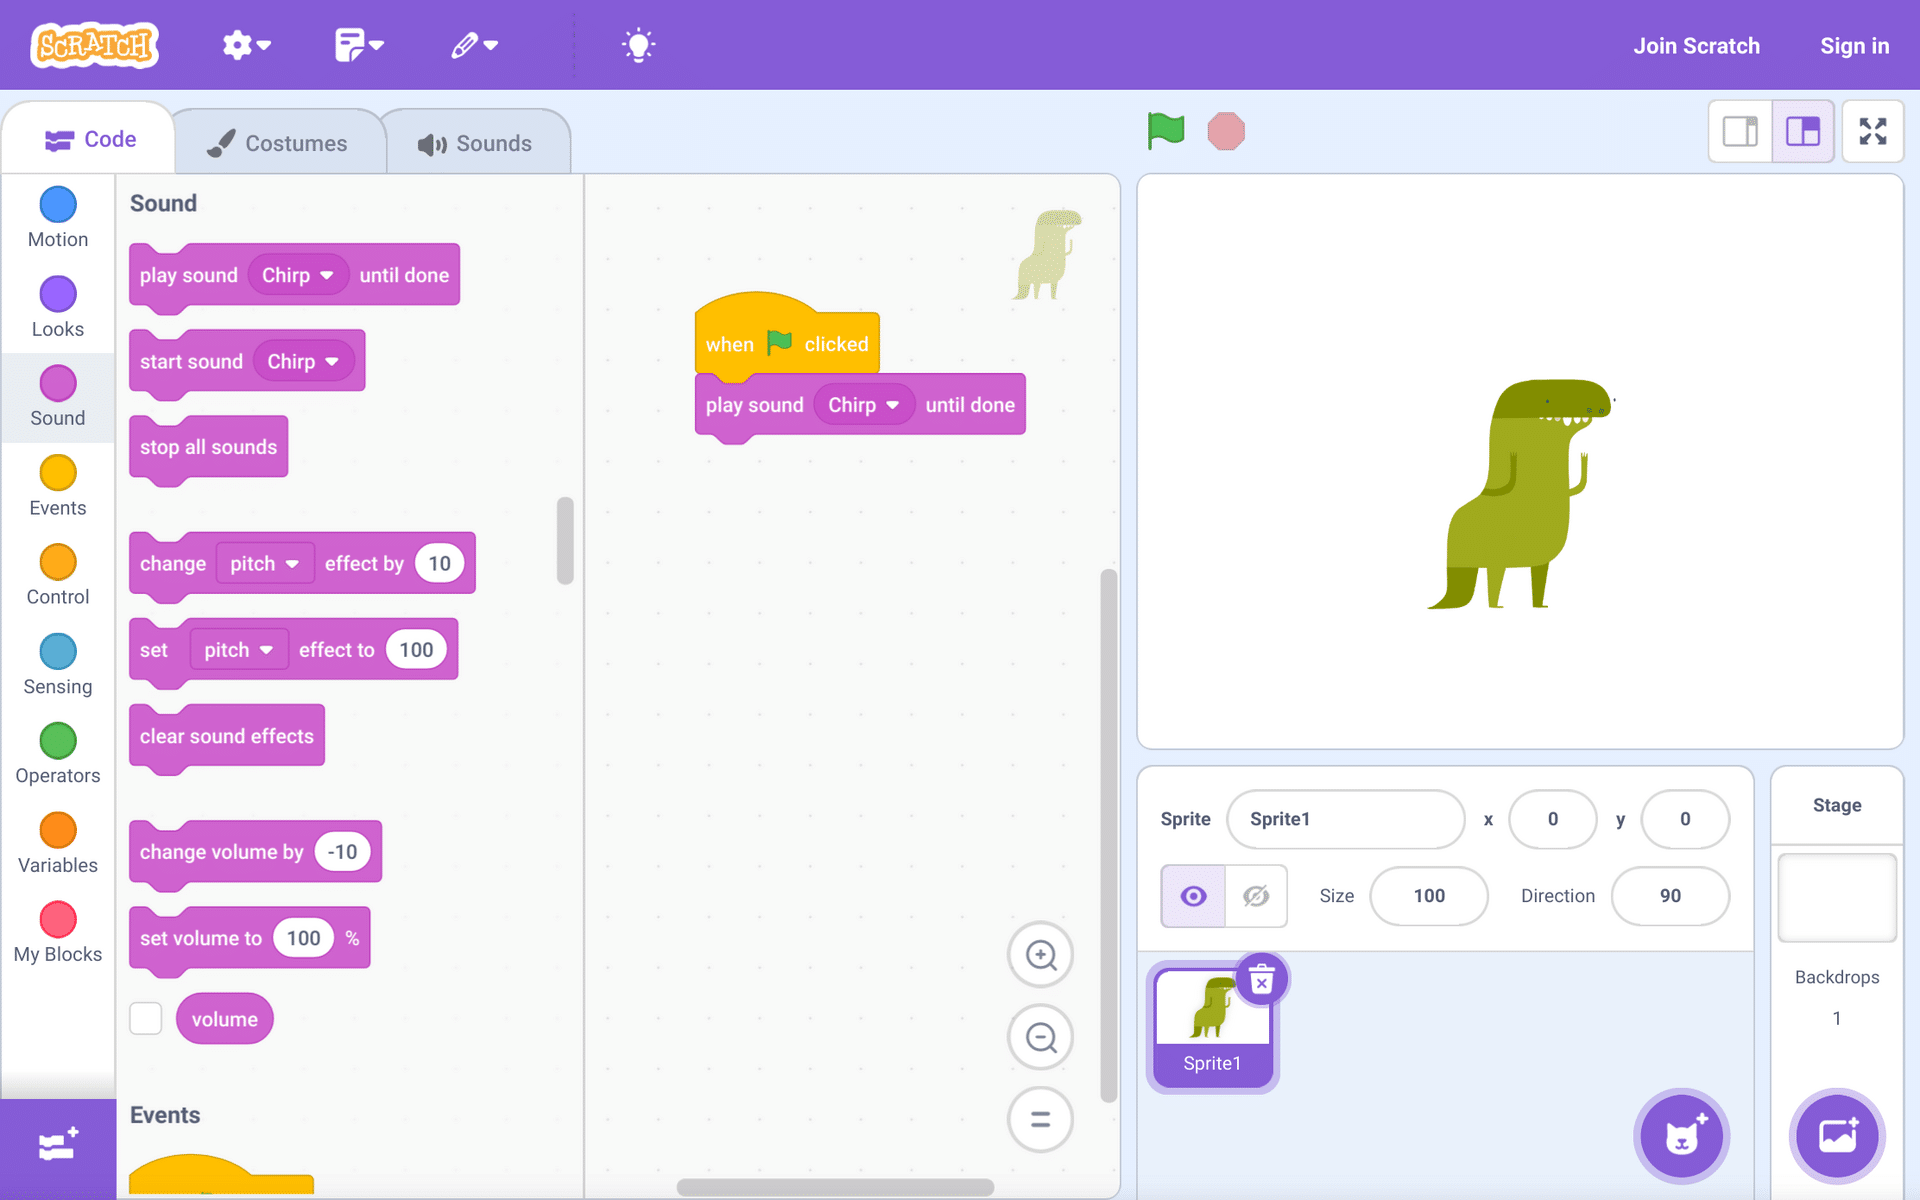
Scratch, one of the great examples of visual programming, designed by MIT. Screenshot from https://scratch.mit.edu/projects/editor
SEAM-EZ: Stateful Event Analytics with Ease

Figure 1: SEAM-EZ is a “no-code” framework that allows people from various backgrounds to easily and visually create stateful metrics.
A real-time demo for stateful fitness analytics example using SEAM-EZ! SEAM-EZ makes it easy for non expert analysts to express sophisticated stateful analysis in a matter of minutes. Visual programming and real time interactivity make stateful analysis easy and fun!
The video demo shows SEAM-EZ’s user-friendly user interface (UI), which enables users to dynamically build and refine stateful metrics through a simple drag-and-drop interface to add operators.
SEAM-EZ builds on the intuitive and expressive TimeState operator library. This library simplifies the process, reducing the time and technical knowledge typically required to execute complex stateful analysis. To help users understand the semantics of the operators, we provide animated previews using toy examples. SEAM-EZ offers immediate timeline previews that visually confirm how data alterations affect outcomes, facilitating deeper understanding and quicker adjustments. This fosters an experimental approach to data analytics, encouraging users to iterate and refine their metrics through real-time visual feedback.
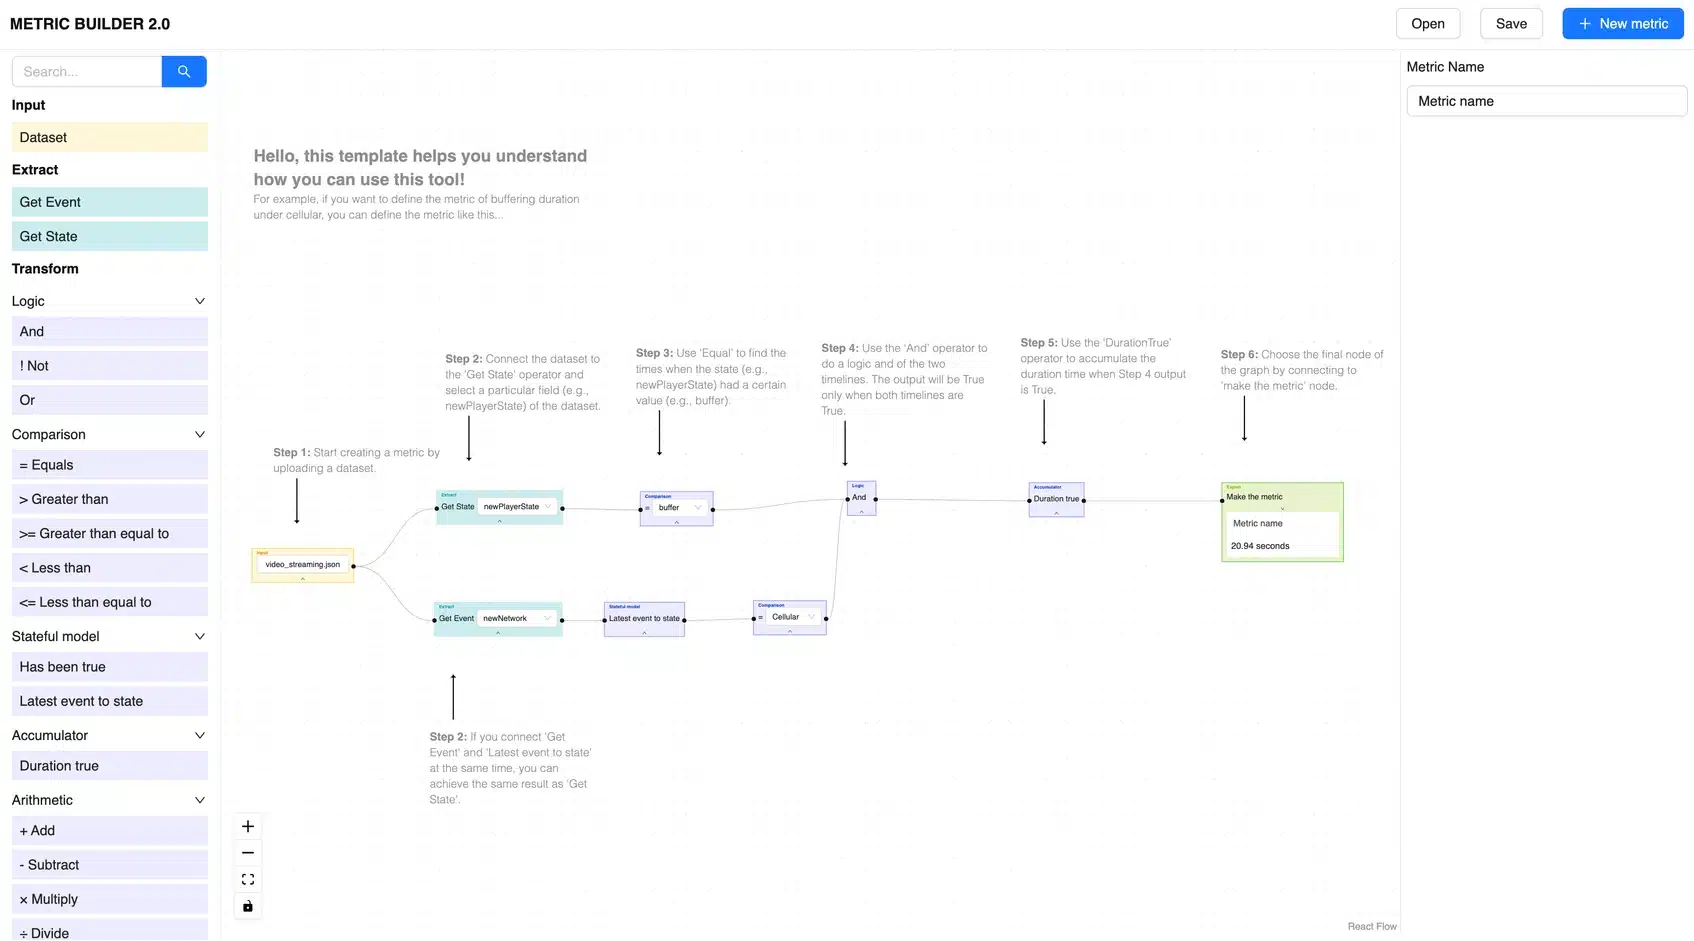
SEAM-EZ uses an intuitive “DAG” editor interface for drag-and-drop of TimeState operators to express the stateful metric

SEAM-EZ provides real-time interactive previews using an intuitive Timeline visualization of the current operation chosen by the user
By lowering the technical barrier for engaging with complex datasets, SEAM-EZ democratizes stateful analytics for a diverse array of professionals to delve into data analysis. The platform’s versatility makes it ideal for applications ranging from real-time media content analysis to intricate financial forecasting and sensitive cybersecurity monitoring.
How We Built SEAM-EZ
In designing SEAM-EZ, we followed a rigorous methodology with best practices in human-computer interaction (HCI). Specifically, twe followed an iterative design process to create SEAM-EZ by starting with a foundational study that interviewed stateful analytics practitioners, followed by two rounds of prototyping and formative evaluations, and finally a summative evaluation in the form of real-world case studies. We engaged more than 30 practitioners with different roles and varying degrees of technical expertise, such as designers, product managers, customer satisfaction representatives, data scientists and software engineers.

Our iterative design process of creating SEAM-EZ
SEAM-EZ enables users with limited to no expertise in coding to quickly explore and activate their data sets by creating rich, sophisticated stateful metrics to drive key business outcomes.
We ran rigorous user studies and found that users were able to create stateful analytics using SEAM-EZ and spoke highly of the system. They said SEAM-EZ is more intuitive thanks to its no-code visual programming support and makes the creating stateful analytics less time-consuming than traditional approaches such as SQL.
We also measured these practitioners’ subjective assessment of SEAM-EZ using an existing five-point scale. SEAM-EZ was rated better (higher) than the SQL counterpart in all five aspects: user satisfaction with the final results; the system helping the user think through the outputs; the system being transparent about how it arrives the final results; the user feeling in control when creating with the system; the user feeling that s/he was collaborating with the system to come up with the outputs.
Product managers reported that they can write a query in 15 minutes, something that would have previously taken weeks and required prioritizing on a data science backlog. Engineering leaders said this would accelerate the velocity of metric development by an order of magnitude.
What’s Next?
The positive reception SEAM-EZ received at CHI 2024 represents another step on our innovation journey. We continue to refine our tools to meet users’ sophisticated needs, adapt to new challenges and maintain our leadership in democratizing stateful analytics for operational use cases.
We anticipate that the foundations behind SEAM-EZ will reshape the landscape of operational data analytics, simplifying complex processes and making high-level tools accessible to a broader audience.
Originally published on The New Stack


