Here at Conviva, we aim to revolutionize traditional operations practices by putting the focus back on what matters most: Quality of Experience. Whether you’re aiming to find and fix problems, plan for the future, or track performance changes, your decisions need to be based on Stateful Metrics that are made for the unique goals and nuances of your business.
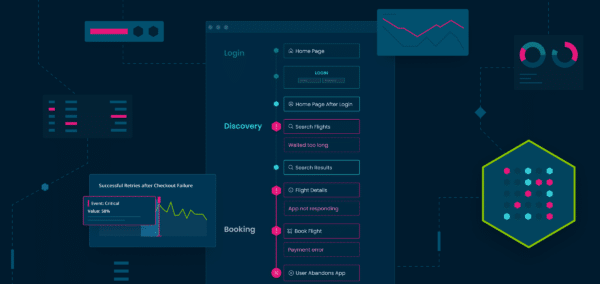
Standard metrics like uptime and page loads are important for assessing the overall system health. However, they don’t reveal what your users are experiencing in real-time. With Stateful Metrics, it goes beyond simply showing slow load times or crashes. They track every interaction a user has within the app – every click and every step. If someone encounters difficulty logging in, signing up, or finding what they need, you get alerted immediately.
You may not have heard of a Stateful Metric before – that’s not surprising because they aren’t easy to create. To create a Stateful Metric, you need a massive amount of compute power because Stateful Metrics are not reset between individual transactions or events. Instead, they accumulate or update their values based on all previous inputs or events. This is useful in scenarios where the overall performance or experience of an application needs to be optimized over a period or across a series of events, like the user journey of a potential customer as they navigate through a recommendation carousel or when they add products to a shopping cart.
In this blog, we’ll walk through the key steps to craft Stateful Metrics that will help your team make faster, more informed decisions in real-time. Plus, we’ll walk through how quickly and easily you can define and build these Stateful Metrics within Conviva’s Operational Data Platform.
Step 1: Determine The KPIs Driving Your Business
Every business has those big-picture goals. But what KPIs and high-level targets can your team actually affect? Things like subscriber revenue and user retention might not seem directly tied to a technical team’s work, but guess what – often technical teams have a huge impact on how those goals are designed and achieved.
Step 2: List Your Most Important User Touchpoints
Every experience is unique, so figuring out which touchpoints line up with your team’s KPIs can help illuminate the kinds of metrics you will want to design. Think about the moments that matter most for your business? It could be the signup process, on-boarding new users, the shopping experience itself, or those features that keep people engaged. As a business leader, you’ll want to be sure those experiences are running smoothly, with good conversion rates and no hiccups. That’s the beauty of Stateful Metrics – you can track that performance and get the insights you need to make your application even better. With Conviva Pulse, you can then analyze Stateful Metrics across many different segments, like user location, device type, and internet connection.
Step 3: Translate Stateful Metrics into a Business Outcome
Now that you’ve listed the experiences that drive success for your business, it’s time to consider how to measure them. This could involve measuring the time taken to complete an action, conversion rates, or frequency of occurrence.
For this exercise, let’s imagine a homepage with items you’re selling on a “Recommended for You” section and you want to optimize a new “Buy Now” button to speed up the checkout process. As a business leader, you’re interested in the effectiveness of finding the item, how many times it’s viewed, and the success rate to purchase with the “Buy Now” action.
With ECO’s Metric Builder, you can create custom Stateful Metrics to measure these data points. To do that, let’s break down our hypothetical shopping experience into three steps:
-
- Discovering the item from the “Recommended for You” section of the homepage.
- Viewing the item’s details on a page.
- Executing the “Buy Now” action.
To measure the success of this experience, we can define four Stateful Metrics based on the actions and events that occur during these steps:
-
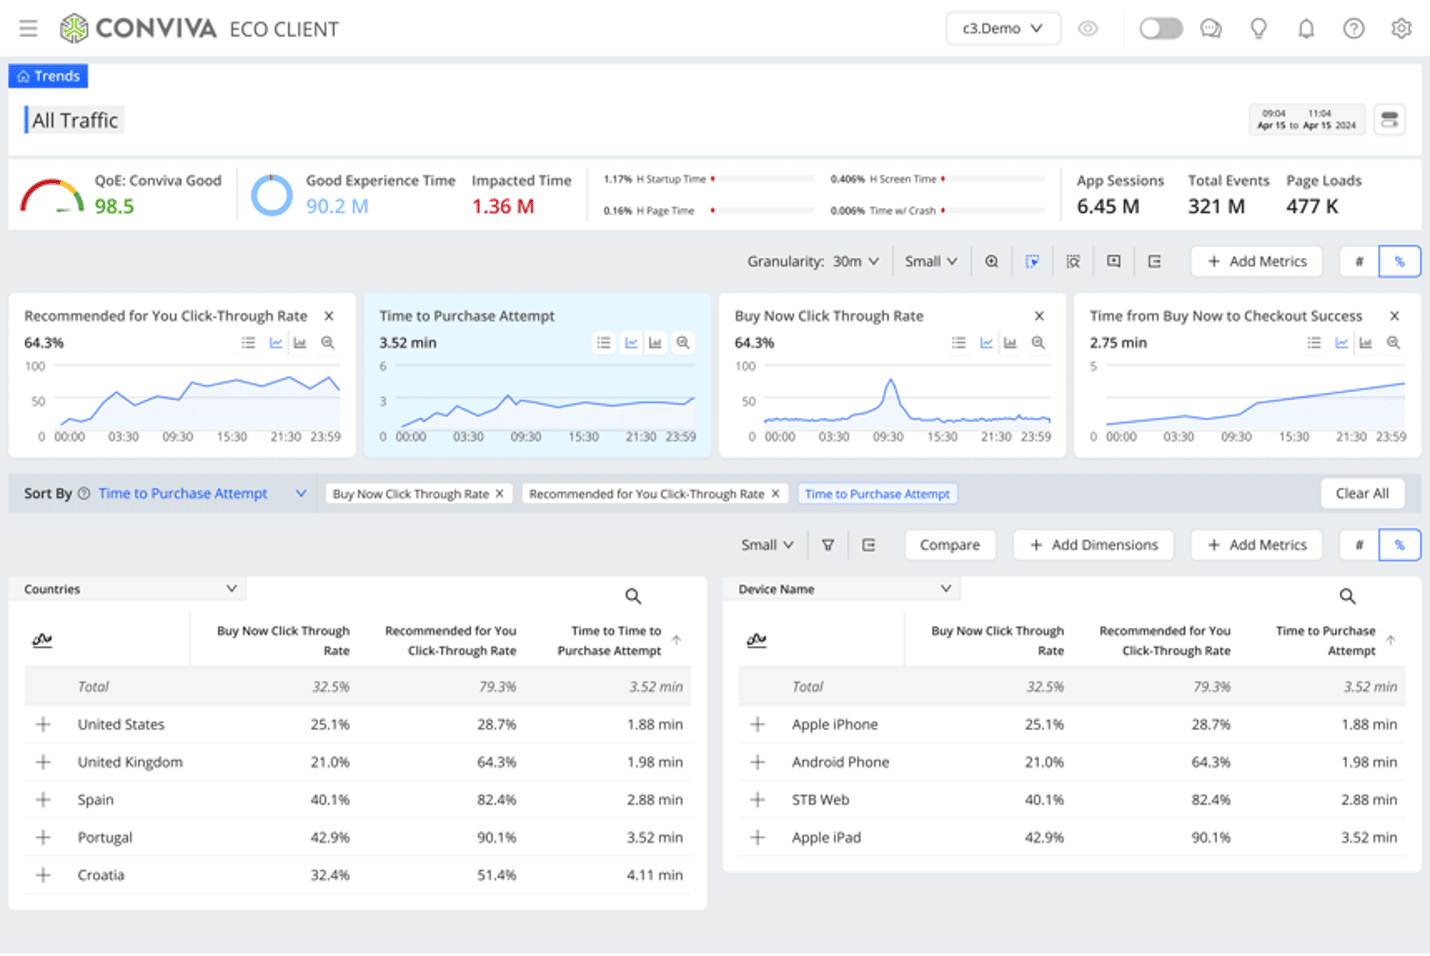
- Recommended for You Click-Through Rate: Percentage of item view clicks compared to the number of times the item was seen in the “Recommended for You” section on the homepage.
- Time to Purchase Attempt: Average time a user spends on an item page before clicking “Buy Now”.
- Buy Now Click Through Rate: Percentage of “Buy Now” clicks compared to the number of item views.
- Time from Buy Now to Checkout Success: Average time from clicking “Buy Now” to successfully completing the purchase at checkout.
These are just a few of the metrics you can define to measure this one aspect of your user experience. The key thing is, all these metrics are stateful – meaning they track how people actually progress through your application, not just how many times they click something. Think of the difference between ‘Total Item Page Views’ and knowing how many of those views lead to purchases. Stateful Metrics will tell you if your experience is getting results.
Step 4: Get Building!
With Conviva’s Operational Data Platform, building these Stateful Metrics can be completed with just a few clicks. No need for complex instrumentations and endless lines of code, our No Code platform makes it so any team member (no matter how technical) can select the most relevant user events and quickly turn them into Stateful Metrics.
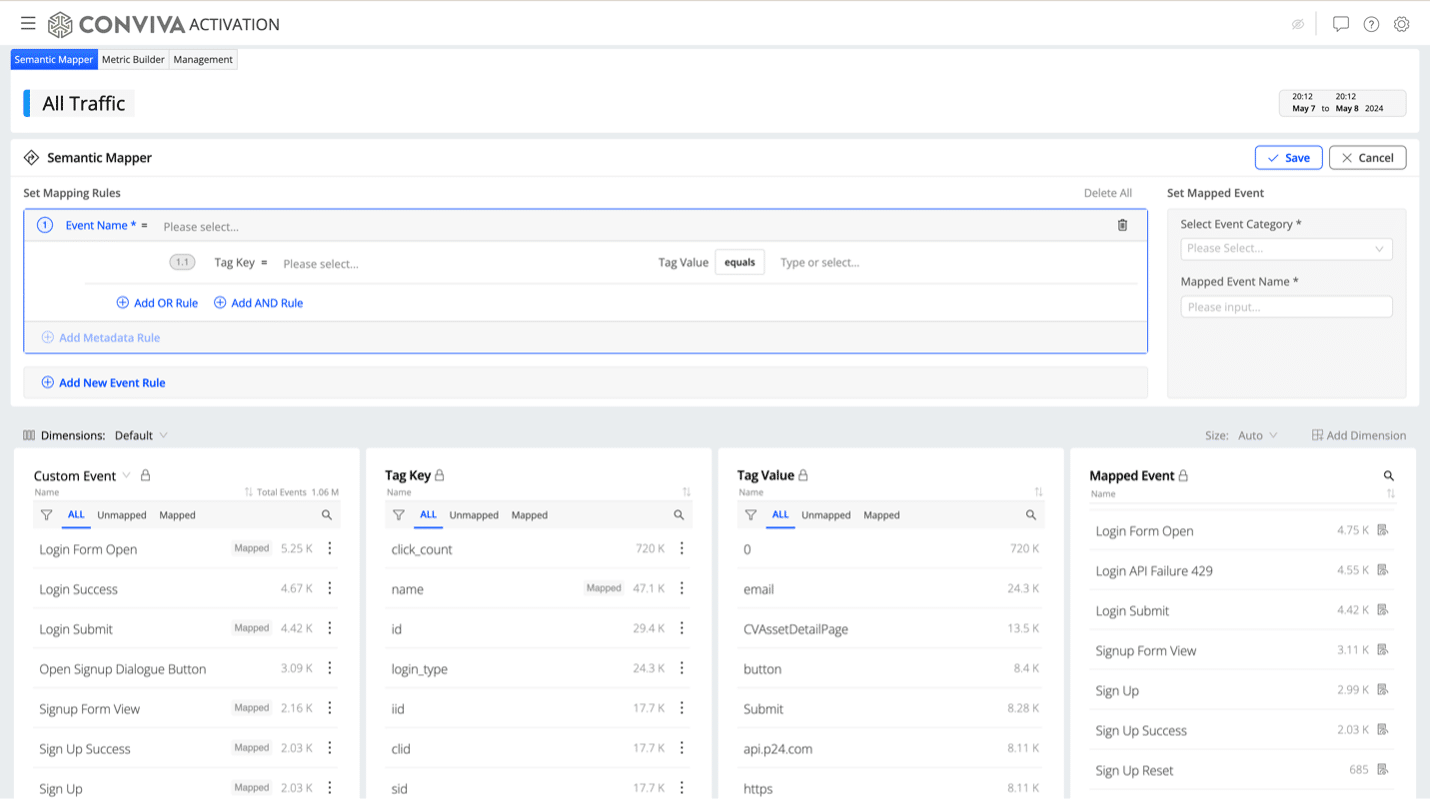
Our Semantic Mapper allows you to pull in the events that matter most for your business. This tool allows you to translate raw events into business events—that is, common-sense events that have an impact on your business operations. You can block events that aren’t of interest, allowing you to control costs and keep visibility only to the events that matter most.
In our example, you can pull in events like “Item Button Click”, “Item Detail Page View” or “Buy Now Click” that will eventually roll up into a stateful experience metric.

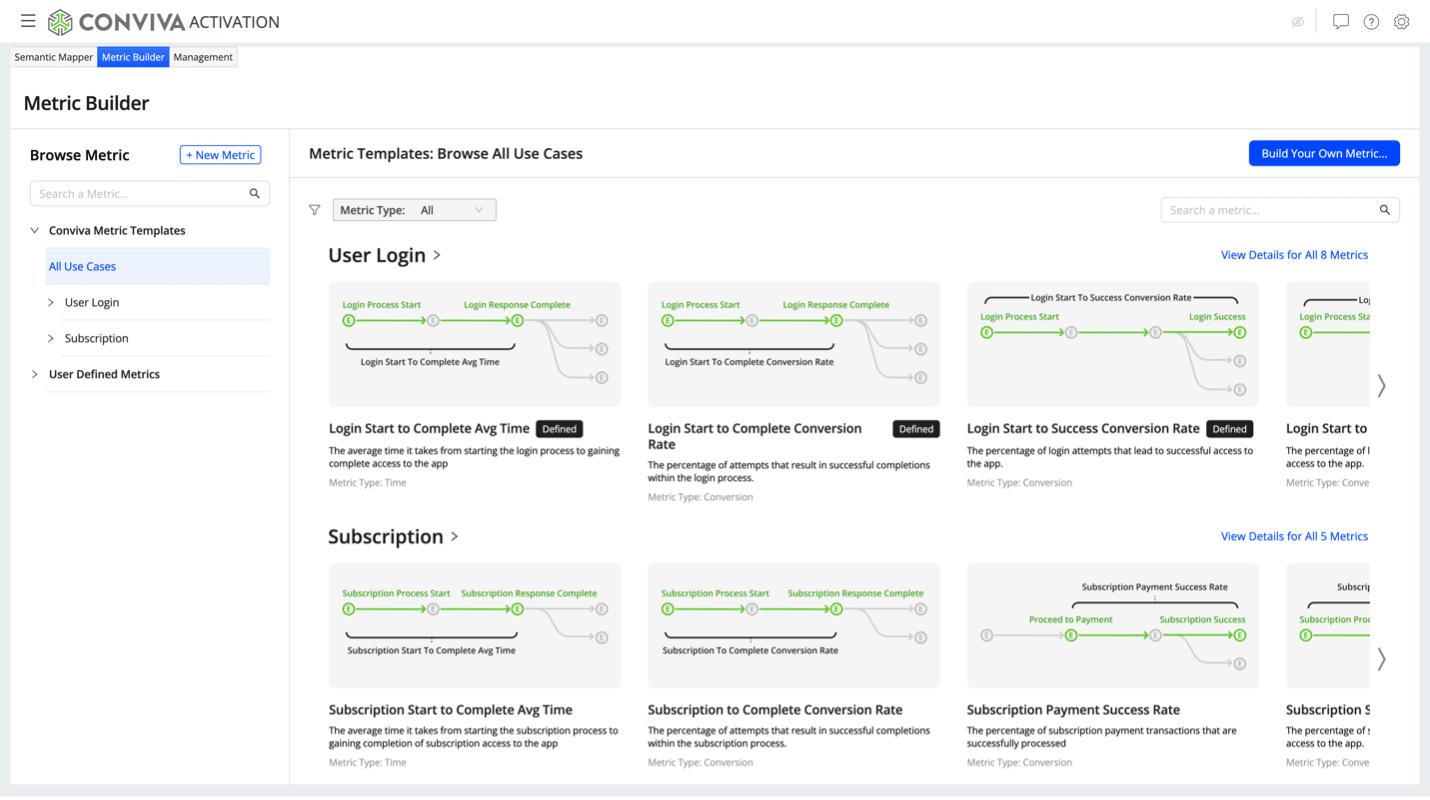
Once your events are mapped, then you can use our Metric Builder to orchestrate how those events are computed into a Stateful Metric. Want to measure “Time from Buy Now to Checkout Success”? Just select the relevant events in that process and create a Time Interval metric to measure the time it takes from a user clicking “Buy Now”, through all the relevant events in that flow, to finally completing checkout.

Step 5: Rinse & Repeat
With your own application, you can expand your collection of Stateful Metrics by following this process: decide on your KPIs, break down your experience into logical steps, and then, define custom metrics based on the actions and events that occur within those steps. Finally, utilize Conviva Pulse to track these experience metrics across different segments, ensuring the best performance and user engagement in your application.

If you’re interested in learning more on how to build custom Stateful Metrics, visit Conviva’s Learning Center. For more insights into our vision for ECO, check out our blog on The Case for Experience-Centric Operations.


