When Your App Lives or Dies by Die-hard Sports Fans
Hall of Famer Rogers Horsnby once said, “People ask me what I do in the winter when there’s no baseball. I’ll tell you what I do. I stare out the window and wait for spring.”
Millions of baseball fans feel the same way, none more than the die-hard fans that can be found tailgating in Harlem River Lot, Rupert Plaza, or anywhere on the Concourse in New York.
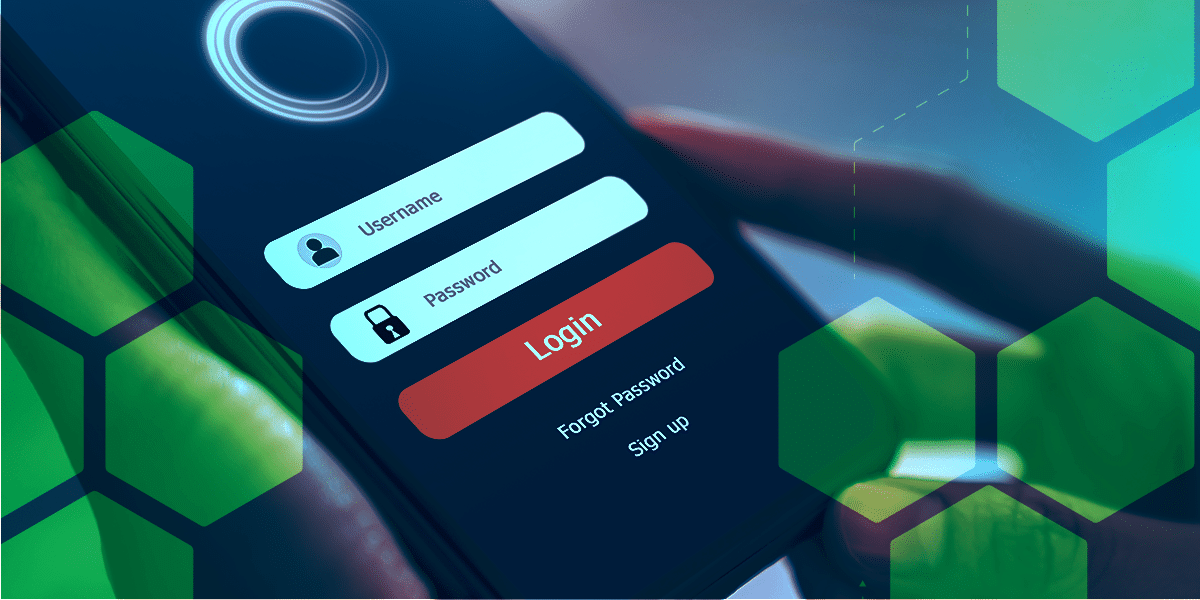
It’s these die-hard fans that log into the mobile apps of streaming publishers that air every game, every series, and every post-game analysis. And with fans like this, your mobile app better perform to their die-hard expectations.
Streamlining Login for Baseball Fans
A popular baseball streaming publisher knew they needed to streamline their login experience. Loyal fans were tuning in multiple times a week for games, so they wanted to make sure fans could get to their content without missing a single pitch.
But the streamer didn’t have full visibility into that process. Login authentication passed through multiple systems, meaning there was no single server that could be used to measure response time. Getting to the insights they needed would require integrating data across multiple data sets, including 3rd party data they didn’t have access to. Plus, integrating that data, normalizing it, and making it actionable in real-time was nearly impossible.
With such a loyal audience, the streamer knew they had to deliver nearly perfect app login experiences to keep fans coming back – but they were stuck with incomplete data and a partial view of their fans’ application experience.
Unlocking User-Centric Experience Measurement
Enter: Conviva for App.
With Conviva for App, the streaming publisher leveraged semantic mapping to quickly map the relevant events associated with login. Now they could capture every step of each login experience – from when the user typed in their credentials, to when they clicked login, to the backend authentication granting fans access.
From there, they could quickly develop a metric around Login Processing Time – just by measuring the time it took to complete those key login events. With simple instrumentation of user events, the sports publisher could get to those critical metrics they needed without integrating any 3rd party data.
They now had a clear lens into everything impacting login, enabling the streamer to monitor, manage, and optimize their interactions like never before.
Solving Login Issues Before the First Pitch
Their enhanced user monitoring capabilities were soon put to the test. The baseball streaming publisher was prepping for Game 1 of their series against a key rival when they noticed a sudden uptick in login processing time.
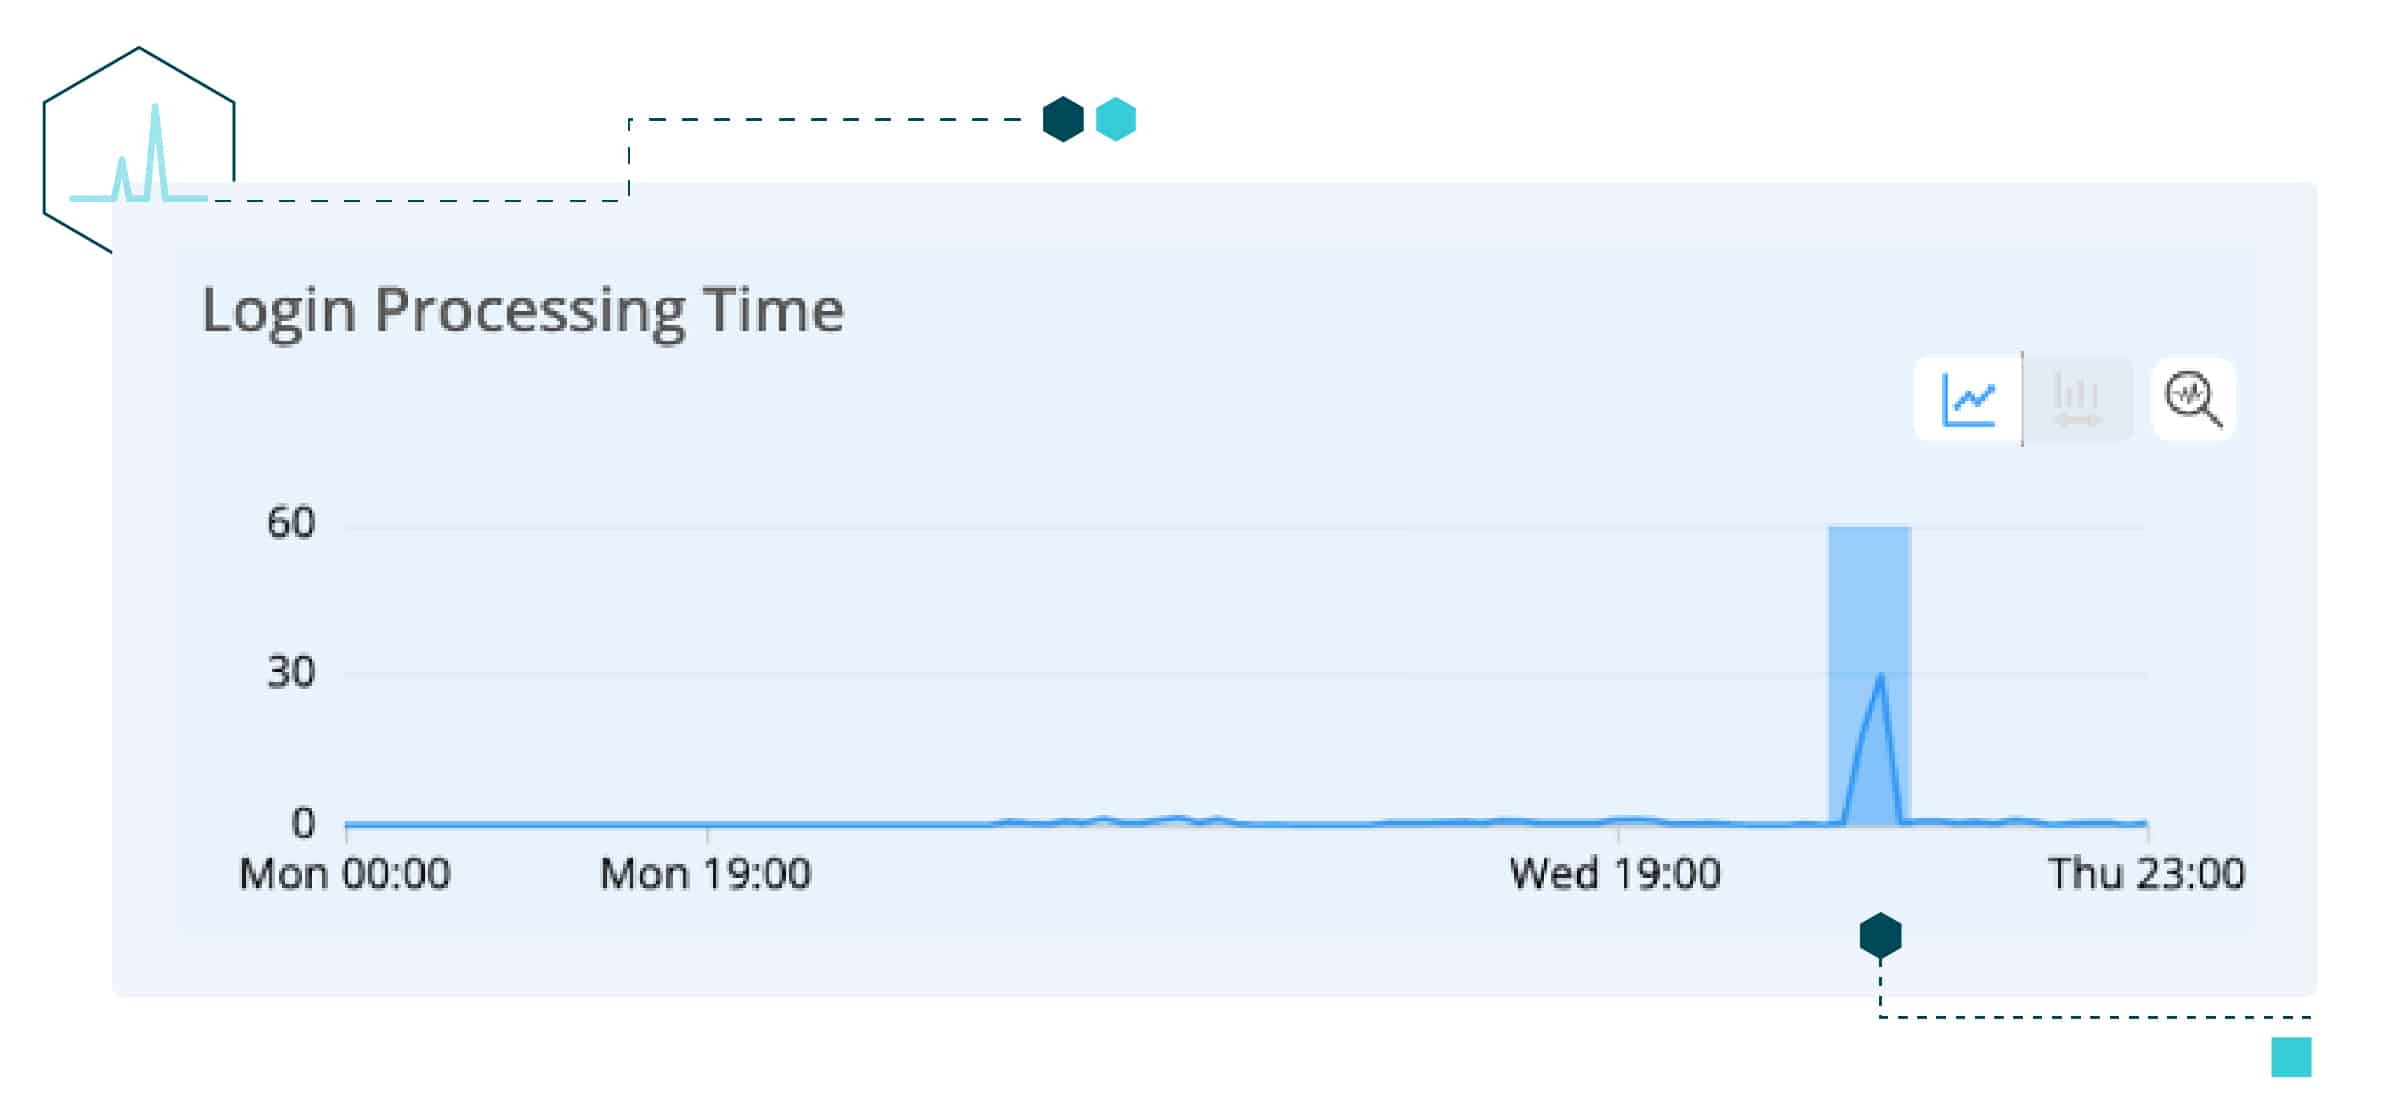
With the Wednesday night home game fast approaching, the team knew they needed to act fast. If fans couldn’t login for the top of the first inning, all the excited fan chatter on social media would quickly turn into angry complaints.
Using Conviva’s Instant Filtering, they drilled down to the impacted viewers, zooming into the specific devices and operating systems experiencing the issue.
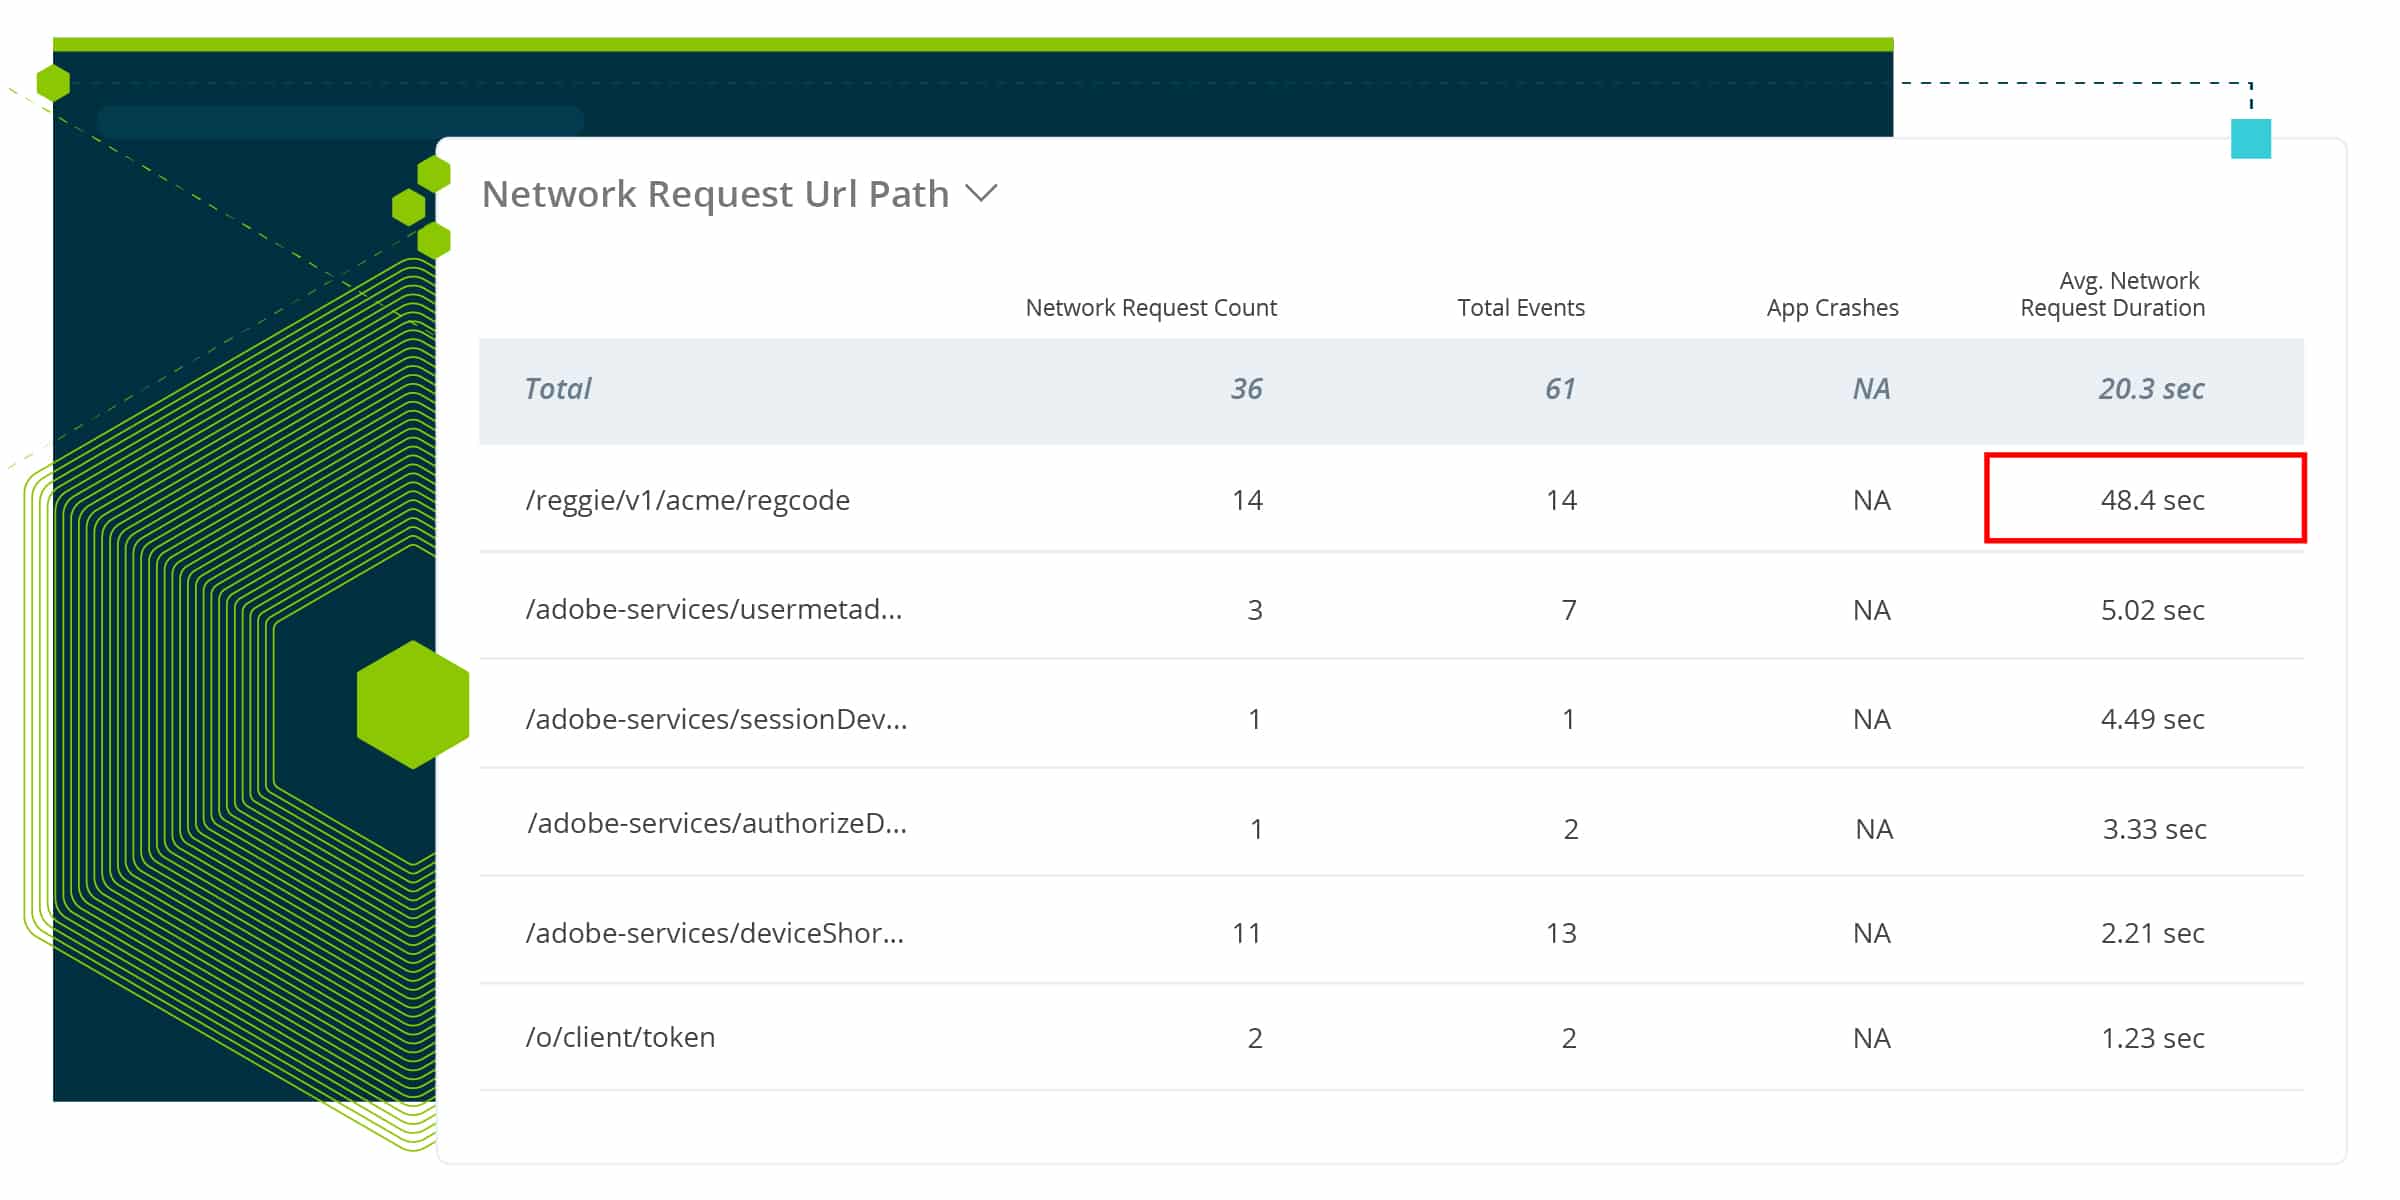
From there, a team member noticed that a 3rd party authentication service was reporting abnormally high network request times. They knew they were on the right track to finding the root cause of their issue. They then drilled down into that authentication service and found the specific broken URL request causing the increase in login processing time.
Luckily, the baseball streamer was able to quickly solve their issue and fans didn’t miss a minute of the game.
In just 4 clicks, the sports publisher was able to identify the issue, drill into impacted devices, and diagnose the root cause from a 3rd party authentication service.
Since the streamer didn’t have access to any 3rd party data, it would have been nearly impossible to detect that root cause with traditional observability tools. The team would have had to scroll through endless authentication logs to even notice that authentication was taking longer than usual. And it would have taken days to understand why.
That would have meant a bad experience for baseball fans and a massive hit on the streamer’s reputation. With stiff competition in the sports streaming space, an issue like that can mean millions in lost ad revenue and a higher likelihood that fans turn to a competing service.
Luckily, the baseball streamer was able to quickly solve their issue and fans didn’t miss a minute of the game.
Optimizing Real-Time User Experience
For live sporting events, seconds matter. Conviva’s Operational Data Platform can correlate front-end user experience metrics to backend system performance, delivering a real-time picture of any application experience.
That means streamers can act instantly to anything impacting viewer experience – whether it’s in the app itself or part of a backend system – as it’s happening. It’s how the baseball streamer was able to correlate an issue with fans’ login experience to a 3rd party authentication system completely disconnected from their front-end experience.
The ability to connect the dots between user experience and engagement to backend performance is critical to optimizing applications in real-time.
With so many different data sources, it can be overwhelming to monitor and understand what’s actually impacting app performance. With Conviva for App, teams can leverage a single source of user-centric insight to prioritize the improvements that will have the greatest impact on user engagement and react instantly when any issue occurs.
The Conviva Operational Data Platform is the first customer-centric operational analytics solution on the market that gives companies a real-time lens into everything impacting user experience. Operations teams at companies like NBCUniversal, Sky, and SiriusXM use the platform to run their business, including identifying and fix issues as they happen and prioritize what to optimize and when, to boost subscriber and advertising revenue by as much as 22%, increase streaming minutes by 38%, and save up to 62K man-hours in operational efficiency.


