It’s Monday morning. You’re sipping coffee when Slack lights up.
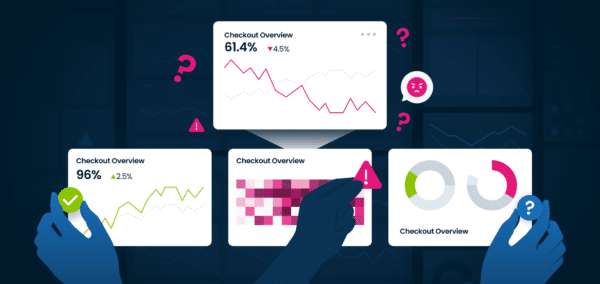
“Any idea why checkout conversions are down 12 percent?”
You hadn’t seen it. Your dashboard didn’t flag it. No alert fired. The drop happened quietly over the weekend, and now the team is scrambling.
You run a funnel analysis. Everything looks normal. You check attribution, A/B tests, release logs. Still nothing obvious.
So, you do what every PM does next.
You message engineering. They say logs are clean. Ops confirms infrastructure is healthy. You slice the data by device, location, and funnel. Still no smoking gun.
Meanwhile, KPIs are bleeding, and your roadmap is stuck in limbo.
You’ve got dashboards, funnels, and charts. But when conversion rates drop, the answers aren’t where they should be.
Diagnosing conversion rate drops shouldn’t feel like detective work. Yet for most product managers, the root cause remains a mystery despite having a stack full of analytics tools.
Why Diagnosing Conversion Drops Takes Too Long
When metrics move, product teams don’t just need data. They need fast, clear answers.
But most analytics tools only tell you what happened, not why.
-
- Funnels show drop-off but not the cause.
-
- Event logs track user clicks but not whether the system responded.
-
- Heatmaps highlight friction but not its technical root.
And while you’re chasing clues across tools, customers are hitting dead ends. Product decisions stall. Revenue quietly disappears.
The Real Cost of Slow Conversion Diagnostics
Every day spent searching for root causes creates compounding drag:
-
- Experiments and optimizations are delayed.
-
- Teams waste hours in cross-functional triage.
-
- Feature bets move forward without confidence.
-
- Silent UX failures chip away at retention and trust.
Worse, your team loses confidence. You stop trusting the metrics. You ship features without knowing which flows are silently broken.
Why Traditional Product Analytics Miss the Root Cause
Most product analytics tools were not built to connect behavioral, engagement, and technical performance in a single view.
They offer visibility, but only in fragments. When issues stem from latency, third-party APIs, or OS-specific bugs, you are left guessing.
You’re not flying blind because your team lacks skill. You’re flying blind because your tools were not designed for diagnostic speed.
Diagnosing Conversion Drops in Seconds, Not Days
Now imagine opening your dashboard and immediately seeing:
-
- Where the drop began
-
- Who is affected, such as iOS 18.3 users on app version 5.1 in California
-
- What is causing it, such as a third-party payment API that slowed overnight
-
- How much it is costing you, like $26,000 per day in lost checkouts
And imagine finding it in 60 seconds, not six days and three meetings.
That is the difference between real-time diagnostics and reactive guesswork.
Product Teams Deserve Better
You don’t need another retroactive chart. You need root-cause clarity at the moment issues arise.
High-performing teams are moving faster by rethinking how they approach product analytics. They are replacing stitched-together tools with unified, real-time platforms that diagnose problems before they become revenue leaks.
Next post in the series:
Cross-Functional Root-Cause Analysis: Why Product, Engineering, and Ops Can’t Align
Conviva empowers the world’s leading brands to deliver flawless digital experiences and drive growth with real-time performance analytics and precise AI-powered insights and automation. By leveraging and computing client-side data from all users while they are in session, the Conviva platform unifies customer experience, engagement, and technical performance with business outcomes. This approach reveals issues and opportunities that other solutions miss, helping you boost conversions and revenue, optimize engagement, and proactively resolve issues before they impact your customers.


